Wednesday, April 30, 2025

What is this rhythm? And what should we do about it?

This was written by Hans Helseth, with Ken Grauer, and a bit of help from Smith 


Without any patient information, how might you interpret this rhythm?

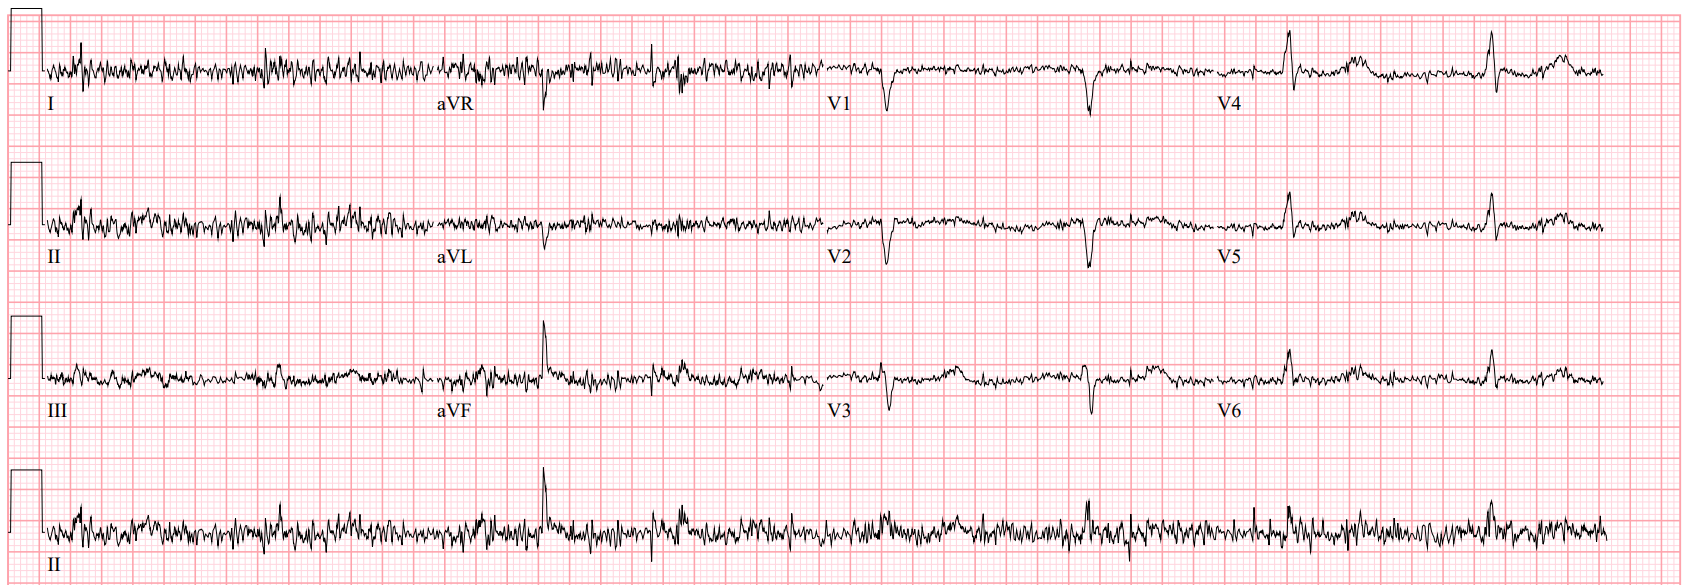
    This is a supraventricular rhythm. There is a regular narrow complex tachycardia at a rate of 118 BPM with a normal axis. 


Below is a lengthy discussion of the diagnosis of this rhythm.  But we in Emergency Medicine don't always need to know the diagnosis, just what to do.  For that see the very end of the discussion.

    Atrial activity may not be immediately apparent, but close attention the inferior leads reveals negative P waves hidden within the ST segments. In V1, small high frequency upright P waves are also visible. We can surmise that these are P waves, and not part of the ST-T complex, because of their high frequency. T waves usually have smoother ascents and descents, while P waves have a shorter duration and appear "sharper" on the EKG.

    The negativity of the P waves in inferior leads suggests that the atria are being depolarized by a wavefront moving towards the base of the heart (from inferior to superior; ironically, the "base" of the heart is the superior portion!). This can only happen in a low atrial rhythm or through retrograde conduction from the ventricles through the AV node or an accessory pathway. The interval between the QRS complex and the negative P wave, called the RP interval, is roughly 120 ms.

    This rhythm is a short RP tachycardia. The diagnostic differential includes:

  • Low atrial tachycardia
  • Junctional Tachycardia
  • Orthodromic atrioventricular reciprocating tachycardia (AVRT)
  • Slow-fast AV nodal reentrant tachycardia (AVNRT)
    Low atrial tachycardia with a long first-degree AV block is a possible explanation for this tachycardia. An automatic or reentrant atrial focus close to the AV node may be firing at a rate of 118 BPM and meeting a very slow AV node with a PR interval of about 360 ms.

    An automatic tachycardic focus at the AV junction could also cause this EKG pattern. A junctional tachycardia sends an impulse from the AV node or his bundle simultaneously to the atria in a retrograde fashion (causing the P waves in inferior leads to be negative) and to the ventricles through the bundle branches. 

    Orthodromic AVRT is another cause of short RP tachycardia. This is an accessory pathway-dependent reentrant arrhythmia in which a depolarization wavefront passes down into the ventricles via the AV node and his-purkinje system. The wavefront then travels back into the atria via the accessory pathway and the reentrant circuit continues.

    A fourth explanation is AVNRT. Some patients are born with "dual AV nodal physiology" meaning that the AV node can excite the ventricles via a slow pathway and a fast pathway. The slow pathway conducts depolarization wavefronts slowly and has a short refractory period, while the fast pathway conducts depolarization wavefronts quickly but has a long refractory period. The pathways are connected proximally and distally. The most common clinical manifestation of dual AV nodal physiology is slow-fast AVNRT, often simply referred to as SVT or PSVT:
  • During sinus rhythm, the fast pathway excites the ventricles and the slow pathway meets the fast pathway during its refractory period (Figure 1, Panel A).
  • If a depolarization wavefront (typically from a premature extrasystole) reaches the AV node at a time where the fast pathway is refractory and the slow pathway is not, it travels down the slow pathway alone (Figure 1, Panel B).
  • The depolarization wavefront then meets the fast pathway, which has now recovered from its refractory period, at the distal connection. The arrival of the depolarization wavefront at this junction sends one wavefront to the ventricles through the his-purkinje system and one wavefront towards the atria in a retrograde fashion via the fast pathway (Figure 1, Panel C).
  • When this wavefront reaches the slow pathway at the proximal junction, if the slow pathway has recovered from its refractory period, it activates the atria retrogradely and the slow pathway is once again able to propagate the impulse towards the ventricles, creating a cycle of reentry at the AV node (Figure 1, Panel D).

Figure 1: Initiation and propagation of "slow-fast" AVNRT, which was formerly called "PSVT". (With permission from Grauer K, Cavallaro D: ACLS [3rd Edition - 1993]).


    This is called "slow-fast" AVNRT because the antegrade limb is the slow pathway and the retrograde limb is the fast pathway. "Fast-slow" AVNRT is also possible, but it is much less common. Fast-slow AVNRT is a "long RP" tachycardia, meaning that it manifests with a negative P wave right before the QRS complex as opposed to right after, so we can rule out fast-slow AVNRT as an explanation for this rhythm. 

_________________________________________________
    Dr. Smith sent this EKG into a group chat with no patient information. My immediate response was "AVNRT". This was the first rhythm that came to my mind because it is the most common of the four listed above. Dr. Smith considered AVNRT, but also considered junctional tachycardia. He mentioned that the rate is quite slow for AVNRT.

    Normally AVNRT has a rate of around 150+ BPM. However, patients with a slow pathway that conducts extremely slowly can have lower rates with AVNRT. 118 BPM is slow for AVNRT, but it is not unheard of. Here is an example I saw recently of AVNRT confirmed by EP study at just 99 BPM:


Here is a case series of AVNRT under 110 BPM:

A case series of very slow atrioventricular nodal reentrant tachycardia resembling junctional tachycardia


    Still, junctional tachycardia, while rarer in adults, is more likely to present with a rate of 118 BPM. Read more about junctional tachycardia in adults:

Clinical and electrophysiologic characterization of automatic junctional tachycardia in adults

     Dr. Grauer, below, favors orthodromic AVRT as the rhythm depicted by today's tracing. He cites the relatively longer RP interval as indicative of AVRT. In 1979, Benditt et al. studied 65 patients with AVRT and found that none had RP intervals of 70 ms or less during SVT. Patients with AVNRT had shorter RP intervals on average with values above and below 70 ms. Read here:
    See Dr. Grauer's comment below for his full analysis of today's rhythm and extra input on junctional tachycardia.

    Is it possible to know this rhythm with absolute certainty? No. But there are things to consider in trying to rule in or out different arrhythmia types:
  • How does the rhythm start? Reentrant rhythms like AVNRT, AVRT, and some atrial tachycardias are usually initiated by a premature extrasystole. Automatic rhythms like some atrial tachycardias and junctional tachycardia usually begin with a "warm-up" period, wherein the automatic focus speeds up to a sustained rate rather than starting suddenly at full speed.
  • How does the rhythm behave? Rate variability and slight irregularity is a sign of an automatic rhythm. Reentrant rhythms tend to be regular and do not change much with rate. Episodes of automatic rhythms may terminate quickly, whereas reentrant rhythms are usually more permanent once they're initiated.
  • How does the rhythm terminate? In order for a reentrant rhythm to terminate, the circuit through which it propagates needs to be interrupted. Many times, this happens when a premature beat enters the excitable gap (the part of the reentrant circuit with excitable tissue immediately before the head of the depolarization wavefront). This causes two depolarization wavefronts to collide, which terminates the rhythm. Automatic rhythms more often slow down or stop abruptly, allowing the sinus node to regain control of the heart.
  • Who is the patient? Junctional tachycardia is more common in young children. Adults very rarely have this arrhythmia. AVRT and AVNRT can happen in both adults and children, so patient history is very important. Does the patient have a known history of WPW syndrome or known dual AV nodal physiology? Atrial tachycardia is more common in "sicker" patients and is usually concomitant with another non-cardiac pathology (sepsis, respiratory distress, etc.).
How to manage? --Try adenosine.
In managing a patient with the above EKG, adenosine administration can be a useful diagnostic-therapeutic maneuver. 

Usually, patients with AVRT and AVNRT will convert to sinus rhythm after adenosine administration. 

Patients with an automatic atrial tachycardia will show P waves with no ventricular response for a brief period after adenosine administration. These patients will not convert to sinus rhythm, and usually require management of an underlying pathology to correct their arrhythmia.  

Some atrial tachycardias respond to adenosine.  If it does, then you will think that you treated AVNRT or AVRT.  But this is rare.

Junctional Tachycardia is also an automatic rhythm and will not terminate with adenosine.  If there is no termination, one should provisionally diagnose this very rare adult problem and look for the underlying condition that is causing it and treat than (myocarditis, infections, medications, drugs, electrolytes, etc.) 


===================================
MY Comment, by KEN GRAUER, MD (4/30/2025):
===================================
Today's case is what I call, "A WhoDunnit?". By this, I mean that the 1st question addressed by Hans Helseth and Dr. Smith on seeing the ECG that I've reproduced in Figure-1 — was to determine the likely etiology of the rhythm (ie, Who dunnit?) — with the implication that assessment and treatment of the patient may differ depending on the answer.
  • Hans favored AVNRT (AtrioVentricular Nodal Reentrant Tachycardia).
  • Dr. Smith questioned the diagnosis of AVNRT because of a relatively slower rate than is usually seen with AVNRT (with the usual rate range cited for AVNRT being between 140-280/minute). As a result — Dr. Smith considered JT (Junctional Tachycardia).

QUESTION:
  • How would you describe the rhythm in Figure-1?
  •    — HINT: Do you see signs of atrial activity?

Figure-1: I've reproduced the ECG debated on by Hans Helseth and Dr. Smith.


ANSWER:
As always — I favor the Ps, Qs, 3R Approach, as the most time-efficient way to assess arrhythmias (See My Comment in the January 26, 2023 post for more on the Ps,Qs,3Rs). Applying this system to the rhythm in Figure-1:
  • Sinus P waves are not present (because there is no upright P wave in lead II ). That said — atrial activity is present, in the form of retrograde P waves (See colored arrows in Figure-2).
  • The QRS complex is narrow (because the QRS is not more than half a large box in any of the 12 leads = a QRS ≤0.10 second).
  • The rhythm is Regular — at a ventricular Rate of ~115/minute.

The 3rd R relates to the question of whether atrial activity is (or is notRelated to neighboring QRS complexes.
  • As I note just above — retrograde P waves are present. We know this — because retrograde P waves are negative in the inferior leads (BLUE arrows in Figure-2) — and they are positive in leads aVR, aVL and in lead V1 (PINK arrows in Figure-2).
  • And, these retrograde P waves are Related to the QRS complex that precedes them with a constant RP' interval (ie, the distance from the preceding R wave to each retrograde P wave is constant).

My Description of the Rhythm in Figure-1:
By the Ps,Qs,3R Approach — We've described the rhythm in Figure-1 as a regular SVT rhythm at ~115/minute without sinus P waves. Instead — there is 1:1 retrograde conduction with constant RP' interval. This description suggests the following differential diagnosis:
  • reentry SVT rhythm (either AVNRT or orthodromic AVRT).
  • JT (Junctional Tachycardia).

NOTE: I review in detail in My Comment at the bottom of the page in the March 6, 2020 post of Dr. Smith's ECG Blog "My Take" on the ECG diagnosis of regular SVT rhythms (including assessment of the relative length of the RP' interval). "Armed" with the material in My Comment in that March 6, 2020 post — I was able to quickly narrow down my differential diagnosis of the rhythm in Figure-1 as follows:
  • Sinus tachycardia is ruled out by lack of an upright, conducting P wave in lead II.
  • AFlutter is ruled out because the heart rate of ~115/minute is significantly slower than would be expected for untreated 2:1 AFlutter (that typically manifests a ventricular rate close to ~150/minute [~135-170/minute range] ) — and — there is no sign of 2:1 AV conduction, as would be expected with AFlutter.
  • While not impossible — sustained 1:1 ATach is an uncommon rhythm, that would seem less likely to produce negative P waves in the inferior leads with such a long PR interval.
  • The usual slow-fast form of AVNRT generally does not manifest the moderately long RP' interval that we see in Figure-2 (in which retrograde P waves are seen to occur past the mid-point of the ST segment). Instead — retrograde P waves with AVNRT are typically either hidden within the QRS complex or occur immediately after the QRS, simulating a pseudo-S wave in the inferior leads.
  • Junctional Tachycardia (JT ) — is very uncommon in adults (See below). When JT does occur in adults — in those rare instances in which it manifests retrograde P waves seen after the QRS, the RP' interval will almost always be shorter than that seen in Figure-2 (ie, with an RP' interval seen immediately after the QRS — and not past the middle of the ST segment).

  • Bottom Line: The above considerations left me with orthodromic AVRT as the most likely etiology for the rhythm in Figure-2 (ie, with the reason for the longer RP' interval with orthodromic AVRT being the longer distance reentry impulses must travel to complete a reentry circuit that includes the AP [Accessory Pathway], which is located outside of the AV node).

But What About the Relatively Slow Rate of this Regular SVT?
As per Dr. Smith — the rate of the regular SVT rhythm in Figure-2 is only ~115/minute — whereas the usually cited range for AVNRT is between 140-280/minute (Hafeez & Armstrong — StatPearls, 2023).
  • While true that AVNRT usually manifests a significantly faster rate than 115/minute — there are exceptions in which AVNRT may manifest rates even below the 115/minute of today's case (Higuchi, Scheinman et al — J Cardiovasc Electrophys 33(6): 1177-1182, 2022).
  • As in today's case — when the rate of AVNRT is significantly slower than usual for this reentry SVT rhythm — the rhythm may simulate JT.
  • The mechanism that may account for AVNRT occasionally occurring at a slower-than-expected rate —  is if conduction time over the slower AV nodal pathway is long, and its effective refractory period is short (compared to the ERP of the faster pathway).

Figure-1: I've labeled the "WhoDunnit" ECG debated on by Hans Helseth and Dr. Smith.


How Common is Junctional Tachycardia?
The answer to this question is multifaceted — and more complex than one might think. Starting out with some Definitions:
  • Sinus rhythm in adults is defined when there are sinus P waves at a heart rate between 60-99/minute in adults.
  • The normal AV nodal "escape" rate in adults is between 40-60/minute (and typically between ~50-80/minute in children).
  • An accelerated Junctional Rhythm in adults is defined as a junctional rhythm that is faster than the normal "escape" rate (ie, over 60/minute) — but less than 100/minute.
  • JT (Junctional Tachycardia) — is defined as a junctional rhythm that is ≥100/minute.

WHO Gets Junctional Tachycardia?
True JT is generally considered to be an automatic arrhythmia that arises from the distal AV Node. This distinguishes JT from AVNRT and AVRT — which are both reentrant forms of SVT.
  • Junctional Ectopic Tachycardia (JET — is almost exclusively seen in infants and children. There is both a congenital form (CJET— and a post-operative form (POJET), with this latter form usually occurring within 72 hours after operation for correction of congenital heart defects — and usually being self-limited within several days of its onset.
  • CJET is much less common than POJECT — with early recognition of this congenital form essential because of its high morbidity and mortality, as well as the difficulty with effective treatment.
  • NOTE: Beyond the pediatric age — true JT is not common in adults (Ashraf & Goyal — StatPearls, 2023).

The Semantics of JT vs Accelerated Junctional Rhythms:
Up until my recent reading — I had essentially used rate (by the definitions that I cite abovefor classification of junctional rhythms. My recent review of the literature (especially from Tchou et al — J Am Coll Cardiol EP 9(3): 425-441, 2023) — suggests a different approach:
  • True automatic Junctional Tachycardia (ie, JET, as above) — is primarily a pediatric arrhythmia.
  • Most of what has previously been classified as JT in adults — probably was either slower-than-expected AVNRT or on rare occasions, infra-atrial reentrant tachycardias (ie, in which the His or hemibranches serve as part of the reentrant circuit).
  • Rather than an automatic, paroxysmal rhythm — most faster junctional rhythms in adults as best thought of as accelerated junctional rhythms, in that they are non-paroxysmal, and typically the result of "something else" (ie, sepsis, electrolyte disturbance, acid-base disorder, or otherwise "sick patient" — Digoxin toxicity — post-operative state). These rhythms typically resolve if the "something else" can be identified and treated.
  • While not strictly limited to heart rates of ≤100/minute — these faster junctional rhythms are generally not nearly as fast as true paroxysmal, automatic JT (ie, I still look for "something else" if I encounter a junctional rhythm up to ~110-120/minute — with best treatment often being treatment of the underlying disorder rather than rate-slowing medication).
  • Although rare in adults — true paroxysmal JT is important to rule out in problematic regular SVT cases that are referred to EP Cardiology, because longterm treatment is different than treatment of AVNRT and AVRT (ie, paroxysmal JT is much less likely than reentry SVTs to respond to ablation — and it carries a much higher risk of AV block if ablation is attempted).

================================
Learning Points:
  • The mechanism of JT is increased automaticity arising from the AV Node. This differs from the reentry mechanism associated with AVNRT and AVRT. This difference in mechanism influences therapeutic decision-making.
  • True paroxysmal ectopic junctional tachycardia (ie, JET) — is essentially a pediatric rhythm. In infants and young children — JET may be congenital, but it most commonly occurs as a self-limited arrhythmia in the post-operative state following surgery for congenital heart disease.
  • Accelerated junctional rhythms may occur in adults — but they are not common. Think of some underlying cause if seen — with the "good news" that much of the time accelerated junctional rhythms will resolve if their cause is identified and treated.
  • Rather than artificial distinction by a rate over or under 100/minute between "accelerated" junctional rhythms vs junctional "tachycardia" — I favor the following concept: i) True paroxysmal JT in adults is rare (and capable EP cardiologists will identify those rare cases among the regular SVTs referred to them); andii) Almost all of the faster junctional rhythm cases I have seen up to rates of ~120/minute — will be the result of "something else" — with BEST initial management typically consisting of trying to find and "fix" that something else causing this rhythm.
  • Although the usual rate of reentry SVT rhythms is ≥140/minute — on occasional, AVNRT or AVRT may be seen with heart rates of 110/minute or less.


Sunday, April 27, 2025

HEART Score Zero. Computer Normal ECG. Troponin Undetectable. Speckle Tracking Echo normal.

A completely healthy 30-something year old woman with no cardiac risk factors had sudden onset of bilateral trapezius pain that radiated around to her throat.  It resolved after about 5 minutes, but then recurred and was sustained for over an hour.  She called 911.

EMS recorded these ECGs:

Time 0:
In V2-V4, there is ST elevation that does not meet STEMI "criteria," of 1.5 mm at the J-point, relative to the PQ junction.  But there are also unusually Large T-waves

Called Normal by computer
This is the Zoll algorithm


I sent this to the Queen of Hearts:


Check out our recent article on the Queen of Heart's performance among ECGs manifesting OMI but which were interpreted as normal by the conventional algorithm:


Time = 13 min
T-wave in V2 is now taller and fatter, the ST segment is more straight.
T-wave in V3 is no taller, but it is fatter due to a straighter ST segment
This is highly suspicious for early LAD occlusion

Not identified as STEMI, but not normal either
This is the Zoll algorithm


Time = 24 min
No significant change
Zoll did not recognize acute MI, but did not call it normal

These prehospital ECGs were not seen.

The patient arrived in the ED.

The pain completely resolved after nitroglycerine 


Moments later, the this ECG was recorded in the ED when she had been pain free for moments only:
Computer read: Normal ECG.

This was by the Veritas algorithm

The ECG is diagnostic of LAD OMI

However, T-waves are still unusually large; the computer almost never sees this.
The T-wave in V2 is smaller. 
QTc is 444 ms.
STE 60 V3 = 1.5 mm, R-wave amplitude V4 = 15 mm, QRSV2 = 8.5
Formula value is 19.38, which indicates LAD occlusion 
(The most accurate cutpoint is 18.2 -- a value greater than 18.2 has high probability of LAD Occlusion).  

This patient has a nondiagnostic ECG by most rules.  

However, with attention to subtleties, especially when compared with the unseen prehospital ECGs, it is very worrisome.

And to my expert pattern recognition it is definitely LAD OMI


Since I taught the Queen of Hearts, she knows that it is OMI:


The first troponin was below the level of detection (LoD).

If you use something like the HEART score:
1. H  History: She has atypical pain (trapezius) (score = 0)
2. E  EKG: a negative ECG (score = 0)
3. A  Age: = 0
4. R  Risk factors = 0
5. T:  Troponin = 0 [first troponin (contemporary, not high sensitivity) was less than the level of detection). 
Total HEART score = 0.  Risk of 30-day adverse events is less than 1.7%.   Some might send her home.

But maybe she has an acute LAD occlusion that will get even worse. 


The providers did a bedside echo and even used speckle tracking to look for strain:

I think maybe there is an anterior wall motion abnormality, but this is very difficult.  They read it as normal.

Here are a couple shots with strain, or "speckle tracking" on ED Echo:


To, me these look like anterior wall motion abnormality, but I showed them to one of our ultrasound fellows who is very interested in this.

She said:

This is a tough one. I see what you mean, initially when I looked at the image, I also thought there was an anterior wall motion abnormality.  But then on closer inspection, I suspect that maybe the anterior wall is just not being tracked well. In systole, you can see the anterior wall come down and outside of the area that is being tracked (more so than the other tracked walls). Even though the strain values are a little off in the graph (so is the posterior wall) it is still a value range (about -18) that would be considered non-ischemic by the cardiology literature, I believe.  I have been wrong before though! So it is possible that I am misinterpreting the clip. If it were me, I would get values at the level of the mitral valve, papillary muscles, and apex (all in PSS axis). Also, narrowing the area being tracked helps the walls get recognized much better.


As I wrote, the first troponin was below the Level of Detection.

She remained pain free, and was admitted without further serial ECGs.  

When in doubt, one should always get serial ECGs.  Bedside echo is not enough.


At time = 240 minutes (4 hours), the second troponin returned at 1.15 ng/mL.  That prompted recording of this ECG:
Back to normal for this patient.  This demonstrates that all ST elevation of the previous ECGs was ischemic, not normal.  She was having a transient STEMI, briefly.

It is very lucky that she spontaneously reperfused her LAD.  It did not progress to full STEMI with loss of the anterior wall, as in this case.

Also, persistence of a pain free state does not guarantee an open artery.  See this case.

A formal contrast echo was done at this point:
Normal estimated left ventricular ejection fraction, 65%.
Regional wall motion abnormality-distal septum and apex.

She was treated medically for NonSTEMI, pending next day cath, which showed  ulcerated plaque and a 60% thrombotic stenosis in the LAD distal to the first diagonal.  It was stented.


Learning Points:
1. Always get serial ECGs when there is any doubt about what is going on.
2. Use the 4-variable formula!!

12 Example Cases of Use of 3- and 4-variable formulas, plus Simplified Formula, to differentiate normal STE from subtle LAD occlusion

3. Always find and look at prehospital ECGs.  They give extremely valuable information.
4. Hyperacute T-waves remain for some time after reperfusion of an artery.  I always say that "you get hyperacute T-waves both 'on the way up' (before ST segment elevation) and 'on the way down' (as ST elevation is resolving).
5. Wall motion abnormalities are very hard to see, even with advanced Speckle Tracking technology.  They require a great contrast exam and expert interpretation.
6.  This case does not demonstrate it, but a wall motion abnormality may disappear after spontaneous reperfusion (see this case).
7. Patients with transient occlusion may manifest only transient STEMI on ECG.  Subsequent troponins may be all negative and subsequent formal echo may be normal.  See this case


===================================
MY Comment, by KEN GRAUER, MD (4/27/2025):
===================================
I find it interesting to periodically look back at my ECG interpretations (and at the interpretations of others) from a number of years earlier. I fully acknowledge that doing so provides a number of "cringe moments" for me (in which I find myself thinking "How could I have said that?" ). But that was then — and now is now.
  • Today's case is a "repost" from March 28, 2017 — or just over 8 years ago ...
  • The "OMI Manifesto" was published by Drs. Meyers, Weingart and Smith shortly after today's repost, in the April 1, 2018 post of Dr. Smith's ECG Blog. 
  • In the 8 years since today's repost — Drs. Smith, Meyers, McLaren and others have published an expanding number of relevant references supporting the OMI Paradigm as proving itself to be far superior to the outdated and insensitive STEMI paradigm (over 80 references already included in this listing, with this number continually increasing — and, with all references conveniently linked for you in Dr. Smith's OMI Literature Timeline, which is found in the TOP Menu Tab of every page in this ECG Blog). 

The Initial ED ECG from Today's Case:
As per Dr. Smith — the 3 prehospital ECGs in today's case were "lost", and therefore not seen by ED providers. As a result — initial decision-making was based on the ECG in Figure-1 (which is the 4th ECG shown above in Dr. Smith's discussion — but the 1st ECG that was recorded in the ED). I focus my comments on this initial ED ECG:
  • Initial decision-making in the ED was most probably influenced by the younger adult age (30 something) of this previously healthy (without risk factors) woman — who presented with trapezius pain radiating to her throat, but not to her chest.
  • The patient's CP (Chest Pain) resolved completely after receiving NTG.
  • ECG #4 (in Figure-1) — was obtained very shortly after NTG was given (such that we do not know whether ST-T wave changes might have looked very different after a few more "pain-free" minutes had passed).
  • AND — Remember that today's case is a repost from 8+ years ago.

I found today's repost insightful for highlighting what we hope has at the very least improved — since practice patterns in 2017.

Figure-1: The initial ECG that was recorded in the ED.


What We Hope has Improved:
  • It's hard to know how the 3 prehospital ECGs got "lost". Hopefully in 2025, among the 1st things EMS providers do on arrival in the ED when transporting a "Rule Out MI Patient" with clearly abnormal prehospital ECGs — is to debrief and directly show those tracings to the ED provider.
  • Hopefully in 2025, more providers are aware that as many as 25% of initial Troponin values in STEMI patients may be normal (Wereski, Smith, et al — JAMA Cardiol 5(11): 1302-1304, 2020). As a result, especially in a patient such as in today's case in which the onset of symptoms is so recent and short-lived — it should not be unexpected for the initial Troponin to be normal.
  • Hopefully serial ECGs (with repeat of the initial ED ECG occurring within 15-30 minutes, and as frequently as needed thereafter) are now routine in the overwhelming majority of centers (instead of the 4+ hour delay in today's case until an elevated Troponin finally came back as the prompt to repeat the initial ED ECG).
  • Hopefully a tracing as abnormal as today's initial ED ECG (especially in a patient with new symptoms) — will be promptly recognized.
  • And hopefully emergency providers now realize that although being a younger adult woman without risk factors lowers the risk of an acute cardiac event — it does not eliminate such risk (as today's case conclusively proves). This is all the more true given how abnormal today's initial ED ECG is.

Today's Initial ED ECG:
Recognition of acute LAD OMI until proven otherwise — should occur within seconds of seeing the ECG in Figure-1:
  • After identifying normal sinus rhythm — my "eye" was immediately drawn to the hyperacute T wave in lead V3. The height of this T wave is literally twice that of the height of the R wave in this lead — with a prolonged QTc and an extremely wide T wave base. In a patient with new symptoms — there is no way this giant, hypervoluminous T wave is going to be a normal variant.
  • My "eye" was next drawn to the ST-T wave in lead V1 — which shows ST segment coving, J-point ST elevation, and terminal T wave inversion. There is no way that this is a normal ST-T wave morphology in lead V1.
  • Armed with the knowledge in this patient with new symptoms that leads V1 and V3 are clearly hyperacute — it becomes easy to recognize ST-T wave abnormalities in each of the remaining chest leads.
  • The T wave in lead V2 is taller than the R wave in this lead — and this T wave is clearly "fatter"-at-its-peak and much wider-at-its-base than should be expected, given very modest size of the QRS complex in this lead.
  • The T wave in lead V4 is still huge (over 10 mm tall). And while relative T wave size is less in leads V5,V6 — I still interpreted these lateral chest lead T waves as overly "bulky" compared to what I would normally expect given QRS appearance in these leads.
  • A subtle but additional supportive sign is seen in lead aVL, which clearly shows abnormal ST segment straightening.

Impression:
 In this patient with new symptoms — this initial ED ECG is alreadly diagnostic until proven otherwise of acute LAD OMI regardless of the lack of risk factors — and regardless of the initial normal Troponin.
  • Since this patient's CP has just been relieved by NTG as ECG #4 was being recorded — repeating this initial ED ECG within the next 10-15 minutes would probably remove any doubt one might still have about the diagnosis, since complete relief of symptoms most likely heralds spontaneous reperfusion, that typically is accompanied soon thereafter by resolution of hyperacute ECG changes.

  • I know that I have learned a lot about the diagnosis of acute OMIs over these past 8 years.


Friday, April 25, 2025

Altered mental status, bradycardia

This was written by Hans Helseth.


Paramedics arrived at the house of a 59 year old man after his caretaker called 911 for altered mental status. He was lethargic and slow to respond to questions. He was found to be hypotensive with systolic pressures in the 70s and 80s. An EKG was recorded:

What do you think?


This EKG shows the same 2.5 seconds as recorded by all 12 leads, so it is not ideal for rhythm analysis. However, there are visible upright P waves in front of each QRS complex in inferior leads, which are about 1.28 seconds apart. In other words, there is sinus bradycardia at a rate of about 47 bpm.

In this clinical context, this EKG is also perfectly consistent with a certain pathology which can be easily and quickly confirmed and addressed by any emergency medical staff: Hypothermia.


__________________________________

Patients with hypothermia typically develop EKG changes like sinus bradycardia or bradyarrhythmias, J waves or Osborn waves, and a prolonged QT interval. The severity of these findings correlate with the patient’s core temperature. Hypothermia is classified as either mild, moderate, or severe:

  • Mild: 32°C-35°C (89.6°F-95°F)

  • Moderate: 29°C-32°C (84.2°F-89.6°F)

  • Severe: <29°C (84.2°F)

Patients with severe hypothermia can develop pathognomonic EKGs with massive Osborn waves, long QT intervals, and bradycardia.


See this post:

What is this ECG finding? Do you understand it before you hear the clinical context?


And this post:

Massive Osborn Waves of Severe Hypothermia (23.6 C), with Cardiac Echo


The EKG in patients with moderate hypothermia may show more subtle changes, but rapid identification of these changes in the right clinical context can accelerate therapy to restore a normal core temperature. 

The EKG in today’s case shows sinus bradycardia with Osborn waves in lateral precordial leads, an ST-T morphology characteristic of hypothermia (an Osborn wave at a similar height to the T wave, with a concave ST segment between them) and QT interval prolongation (See Ken Grauer's comment for more details on QTc calculation).


See this post, with a very similar ST-T morphology to today’s case:

Altered Mental Status, Bradycardia

__________________________________


Case Continued:

Paramedics noticed that the patient felt cold. They recorded a temperature which

simply read "low" (below 33.9°C or 93°F, the bottom limit of reporting for their thermometer). The patient arrived to the emergency room where a rectal temperature was recorded at 29.2°C (84.5°F). He also had this EKG recorded:


The findings here are similar to those in the prehospital strip. There is also a more pronounced shiver artifact, which is commonly observed in EKGs recorded on patients with hypothermia. 


The patient was externally re-warmed in the ED with a Bair HuggerⓇ. He was admitted to the hospital for sepsis and his temperature returned to normal the next day. There was no EKG recorded after temperature correction. A repeat EKG after temperature correction would likely have shown correction of the ST-T abnormalities, disappearance of the Osborn waves, shortening of the QT interval, and a faster heart rate.


Reference, written by one of the world's experts in Enviromental Hypothermia, from Hennepin (also where Smith is from), Megan Rischall. Doesn't it make sense that the expert would come from one of the coldest winter metro areas in the U.S? Evidence-Based Management Of Accidental Hypothermia In The Emergency Department


===================================
MY Comment, by KEN GRAUER, MD (4/25/2025):
===================================
Most cases of hypothermia are obvious: For example — A patient is "found" outside, exposed to the elements in a cold weather setting. But this is not the only clinical presentation we see for hypothermia.
  • My introduction to how subtle the presentation of hypothermia can sometimes bewas during my early days as hospital Attending — when a patient who had been on our hospital Service for several days, was found one morning by nursing staff to be unresponsive. The patient was cool (not cold) to the touch, and was not shivering. It turns out that the patient had developed septicemia from an occult infection.
  • Lack of a fever — and stable medical condition in a warm hospital bed initially fooled the in-patient team, with our warm-weather Florida location accounting for limited experience by housestaff with hypothermic patients.

Moral of My Story: Whereas experienced emergency providers are well familiar with hypothermia as a potential manifestation of septicemia — it is easy to overlook a sudden, gradual reduction in body temperature in a poorly responsive, non-shivering patient.
  • Hypothermia may occur in warm-weather locations during warm-weather months.
  • Older, less responsive patients, especially those with multiple co-morbidities, whose temperature regulatory mechanisms are often compromised — are especially susceptible to hypothermia.
  • Hypothermia may be a sign of sepsis. Fever often develops in such patients once the hypothermia is corrected. Check the patient's temperature.
  • NOTE: The "telltale" shivering of hypothermia may be absent in poorly nourished, compromised patients, and in those with endocrinopathy (Nice review by Duong & Patel — StatPearls, 2024).

ECG Findings with Hypothermia:
We've periodically reviewed the ECG findings of hypothermia (ie, among other posts, in My Comment in the February 2, 2024 post — in which we illustrate what could be the largest Osborn Waves that you have seen).
  • In addition to Osborn waves — other commonly associated ECG features with Hypothermia includei) Bradycardia (which may be marked)ii) Atrial fibrillation or other arrhythmias (including VFib); iii) Artifact (from baseline undulations resulting from associated shivering); iv) QTc prolongation (which may be marked)v) ST elevation in multiple leads; andvi) Brugada phenocopy.

Today's Initial ECG: 
For clarity in Figure-1 — I've reproduced today's initial ECG.
  • PEARL: It's important to appreciate that there are many different display formats for ECG recordings. As noted by Hans Helseth — the display format in today's initial tracing shows the same 2 beats in each 2.5 second recording for each of the 4 sets of 3 leads. Thus, we only see 2 beats in this entire ECG
  • The 2 beats that we see in Figure-1 — do appear to be sinus-conducted (since in lead II, we see an upright P wave with fixed PR interval). That said — Because the same single R-R interval is present in each of these 12 leads, we have no idea if the rhythm is a regular sinus bradycardia at ~47/minute — or — if there is irregularity with a significant increase in heart rate elsewhere on the tracing. In a word — We can do no more than guess what the rhythm in this initial tracing is.

Figure-1: Today's initial ECG (showing use of our QTc calculator).


Otherwise in Figure-1:
  • There is relatively low voltage (almost a null vector in lead I ). The PR interval for the 2 beats that we see is normal — and the QRS is narrow. But the QTc (ie, the QT interval corrected for the slow heart rate) is prolonged.
  • As shown in Figure-2 — We've added a QTc Calculator to the lower line of the Tab Menu that appears at the top of every page of Dr. Smith's ECG Blog. Especially given the challenge of reliably determining the QTc interval with slow rhythms — entering the heart rate (47/minute) and the QT interval that you measure (580 msec.) — instantly yields 5 estimates for the QTc. While there is some variation in these estimated QTc values (depending on the specific method used— agreement is excellent in Figure-1 for confirming moderate QTc prolongation in today's initial ECG (average QTc ~535 msec.)
  • The frontal plane axis is vertical but normal.
  • ST-T waves in Figure-1 show nonspecific flattening.
  • Osborn Waves are present (RED arrows) — but are subtle, limited to 2 leads, and would be easy to overlook if not attentive to the ECG findings of hypothermia.

Concluding Thoughts:
The etiology of this patient's hypothermia was septicemia. 
  • Because of the patients poorly responsive state, and a lack of shivering at the time the paramedics arrived — a high index of suspicion for septicemia was needed to expedite diagnosis. Taking the temperature was confirmatory.
  • The patient's initial ECG is consistent with the diagnosis of moderate hypothermia (ie, apparent bradycardia — prolonged QTc — subtle Osborn waves)
  • That said — I thought ECG findings on the initial tracing were more modest than I would normally expect in a patient with an initial rectal temperature of 29.2°C = 84.5°F (? initial core temperature?). I find it instructive that even with this low of an initial temperature — ST-T waves only showed nonspecific flattening — shiver artifact was absent (it became readily apparent on the repeat ECG in the ED) — and Osborn waves were tiny and only seen in 2 leads.
  • Apparently — no ECG was repeated after the patient's temperature was corrected. The ECG of a hypothermic patient may mask underlying ECG abnormalities. For this reason — Always repeat the ECG after correcting hypothermia.

Figure-2: Quick link to the QTc Calculator in the Menu on every Blog page.


Recommended Resources

OSZAR »